Technical indicators are divided into several groups depending on their purpose. As purposes of the indicators are different, a trader needs not one, but a combination of several indicators to open a trade. In this article, we will tell about the 3 most popular technical indicators.
1. Moving Average – an indicator to identify the trend
Moving Average (MA) is a trend indicator. It helps to identify and follow the trend.
Technical principle: MA shows an average value of a price over a chosen time period.
In simple terms: Moving Average follows the price. This line helps to smooth the price volatility and get rid of the unwanted price “noise”, so that you focus on the main trend and not on corrections. It is necessary to understand that this indicator does not predict the future price, but outlines the current direction of the market.
Advantages of Moving Average
- Identifies the direction of a trend;
- Finds trend reversals;
- Shows potential support and resistance levels.
Disadvantages of Moving Average
- Lags behind the current price (will change more slowly than the price chart because the indicator is based on past prices).
Tips
There are 4 types of the Moving Averages – Simple, Exponential, Linear Weighted and Smoothed. The difference between them is merely technical (how much weight is assigned to the latest data). We recommend you to use Simple Moving Average as most traders use this line.
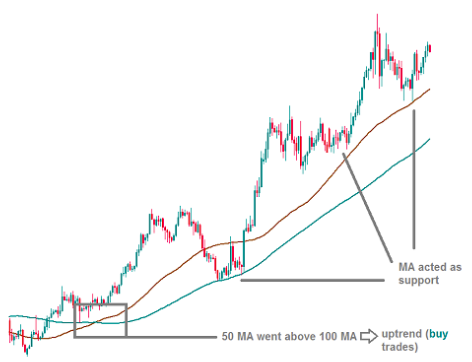
The most popular time periods for MA are 200, 100, 50 and 20. 200-period MA may help to analyze a long-term “historical” trend, while the 20-period MA – to follow a short-term trend.
How to interpret
In short, a trend is bullish when the price of a currency pair is above the MA and bearish – when the price falls below. In addition, note how Moving Averages with different periods behave towards each other.
Upward bias is confirmed when a shorter-term MA (e.g. 50-period) rises above the longer-term MA (e.g. 100-period). And vice versa, a downward bias is confirmed when a shorter-term MA goes below the longer-term MA.
Conclusion
Moving Average shows whether to buy or sell a currency pair (buy in an uptrend, sell in a downtrend). MA won’t tell you at what level to open your trade (for that you’ll need other indicators). As a result, applying a trend indicator should be among the first steps of your technical analysis.
2. Bollinger Bands – an indicator to measure volatility
Bollinger Bands helps to measure market volatility (i.e. the degree of variation of a trading price).
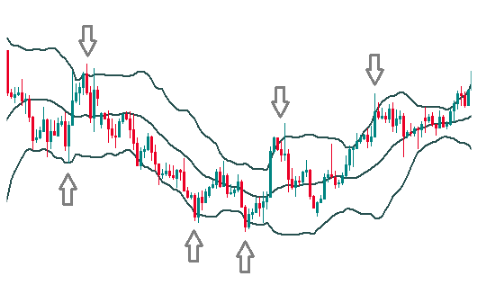
Technical principle: Bollinger Bands consist of 3 lines. Each line (band) is an MA. The middle band is usually a 20-period SMA. It identifies trend direction – just like the MAs described above do. Upper and lower bands (or “volatility” bands) are shifted by two standard deviations above and below the middle band.
In simple terms: Bollinger Bands indicator puts the price in a kind of box between the two outside lines. The price is constantly revolving around the middle line. It can go and test levels beyond the outside lines, but only for a short period of time and it won’t be able to get far away. After such a deviation from the center, the price will have to return back to the middle. You can also notice that during some periods of time Bollinger lines come closer together, while during other periods of time they spread and the range becomes wider. The narrower the range, the lower is market volatility and, vice versa, the bands widen when the market becomes more volatile.
Advantages of Bollinger Bands
The indicator is actually great in a sideways market (when a currency pair is trading in a range). In this case, the lines of the indicator can be used as support and resistance levels, where traders can open their positions.
Disadvantages of Bollinger Bands
During a strong trend, the price can spend a long time at one Bollinger line and not go to the opposite one. As a result, we don’t recommend Bollinger Bands for trending markets.
How to interpret
The closer the price approaches the upper band, the more overbought the currency pair becomes. To put it simply, by this time buyers have already made money on the advance of the price and close their trade to take profit. The result is that the overbought pair stops rising and turns down. The price’s rise above the upper band may be a selling signal, while a decline below the lower band – a buying signal.
The outer bands automatically widen when volatility increases and narrow when volatility decreases. High and low volatility periods usually follow each other, so the narrowing of the bands often means that the volatility is about to increase sharply.
Tips
We don’t recommend to use Bollinger Bands without confirmation from other indicators/technical tools. Bollinger bands go well with candlestick patterns, trendlines, and other price actions signals.
Conclusion
Bollinger Bands work best when the market is not trending. This indicator can be a great basis for a trading system, but it alone is not enough: you’ll need to use other tools as well.
3. MACD – an indicator that shows the phase of the market
MACD (Moving Average Convergence/Divergence) measures the driving force behind the market. It shows when the market gets tired of moving in one direction and needs a rest (correction).
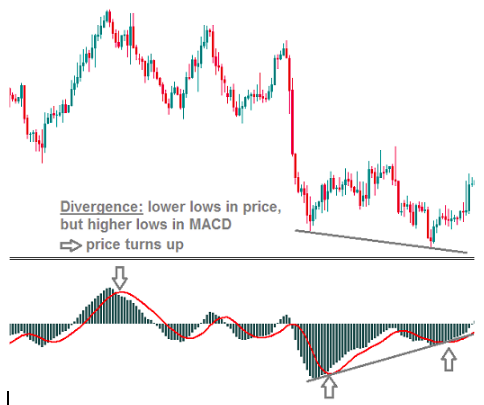
Technical principle: MACD histogram is the difference between a 26-period and 12-period exponential moving averages (EMA). It also includes a signal line (9-period moving average).
In simple terms: MACD is based on moving averages, but it involves some other formulas as well, so it belongs to a type of technical indicators known oscillators. Oscillators are shown in separate boxes below the price chart. After an oscillator rises to high levels, it has to turn back down. Usually so does the price chart. The difference is that while MACD needs to return close to 0 or lower, the price’s decline will likely be smaller. This is how MACD “predicts” the turns in price.
How to interpret
Dramatic Rise/Fall. Sell when histogram bars start declining after a big advance. Buy when histogram bars start growing after a big decline.
Crossovers between the histogram and the signal line can make market entries more precise. Buy when the MACD-histogram rises above the signal line. Sell when the MACD-histogram falls below the signal line.
Zero line as additional confirmation. When MACD crosses the zero line, it also shows the strength of bulls or bears. Buy when the MACD-histogram rises above 0. Sell when the MACD-histogram falls below 0. Note though, that such signals are weaker than the previous ones.
Divergence. If a price rises and a MACD falls, it means that the advance of the price is not confirmed by the indicator and the rally is about to end. On the contrary, if a price falls and MACD rises, a bullish turn in the near-term.
Tips
Crossovers between the histogram and the signal line are the best signal from MACD.
Hunt for divergences between MACD and the price: it’s a good indication of an upcoming correction.
Advantages of MACD
MACD can be used both trending or ranging markets.
If you understood MACD, it will be easy for you to learn how other oscillators work: the principle is quite similar.
Disadvantages of MACD
The indicator lags behind the price chart, so some signals come late and are not followed by the strong move of the market.
Conclusion
It’s good to have MACD on your chart as it measures both trend and momentum. It can be a strong part of a trading system, although we don’t recommend to make trading decisions based only on this indicator.
Also Read: Best Technical Indicators for Forex traders – Part 2


