In mathematics and statistics, covariance is a measure of the relationship between random variables. This metric used to measure how one random variable moves in relation to another random variable. In finance, the covariance of returns measures how the rate of return on one asset/stock varies in relation to the rate of return on other assets or a portfolio. However, the metric does not assess the dependency between variables. Unlike the correlation coefficient, covariance is measured in units. The units are computed by multiplying the units of the two variables. It can take any value between -infinity to +infinity, where the negative value represents the negative relationship whereas a positive value represents the positive relationship. The values are interpreted as follows:
Positive covariance: Indicates that two variables tend to move in the same direction
Negative covariance: Reveals that two variables tend to move in the inverse direction
Calculate in spreadsheet

Covariance can be calculated easily in any spreadsheets such as LibreOffice Calc or Microsoft Excel.
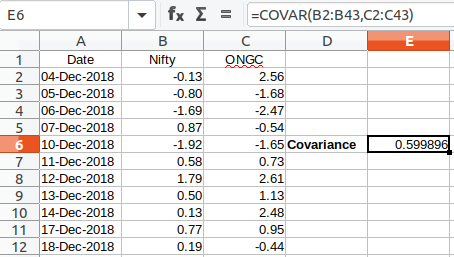
In this example, Let’s calculate covariance between Nifty (NSE Index) and ONGC (stock listed in NSE). The data consist of the rate of returns for the past two months. To calculate covariance use the following formula in any empty cell of the active sheet.
=COVAR(X,Y)
where X is the range of rate of return for one variable and Y is the range of rate of returns for another variable.
In the illustrated example, the formula used is =COVAR(B2:B43,C2:C43) and the calculated value of Covariance is 0.59986. Which implies for the past two months the rate of return of Nifty and ONGC moves in the same direction. In other words, they rise or decline simultaneously.
If you have any queries leave the same in the comment section below.


